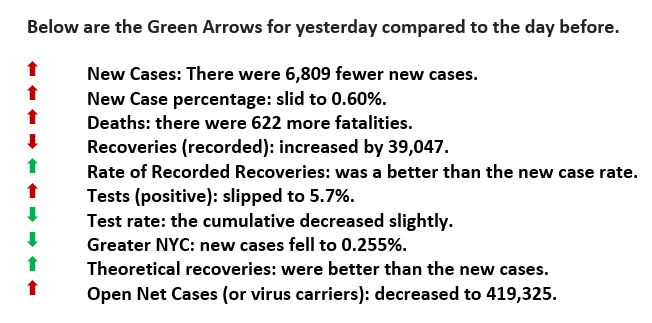
Yesterday was a Four Arrow Day.
Fatality Rate Slows
Good Morning,
Yesterday was a FOUR Green Arrow Day. Below are the particulars for the day.
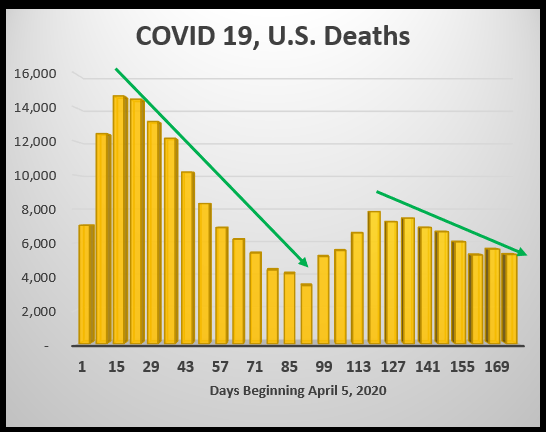
We reached a high of more than 2,000 deaths per day during mid-April. The number dropped to about 1,000 per day in August, and for the last two weeks of September, it is averaging just under 760. The below graph shows the “first wave” trend and then the “second wave.”
The fatalities rate was as high as 6.1% in May and has now fallen to 2.8% based on the US, having recorded 7.4 million cases of COVID 19. Notice the term “recorded cases.” We still don’t know the actual number of cases; many of those who contracted the virus went unreported because they were asymptomatic. The CDC has reported that more people may have been infected as many as ten times and not reported.

Fatalities in the USA
The graph covers the period from week ending April 4, 2020, through September 29, 2020.
Note the two green arrows showing the overall trend for each of the two waves.
Source: Worldometer

Please click here for references. If you have not already registered, register now to receive the latest updates on the unprecedented COVID-19 pandemic.

