Yesterday was an EIGHT Green Arrow Day.
Good Morning:
Pretty good news all around in our progress in slowing the spread or flattening the curve.
1. New case rate dropped to 2.1% the lowest recorded so far.
2. The Boston / NYC corridor’s rate fell to 1.0%, while NYC’s rate dipped below 1%.
3. There were more tests, 83, but there were 2,635 fewer cases.
One ambition of this newsletter is to use data to help policymakers make better decisions to keep us safe while we begin to lift restrictions across the US. With data, information and analytics, we might be able to identify risks more specifically and then take a laser approach to minimizing or eliminating those factors.
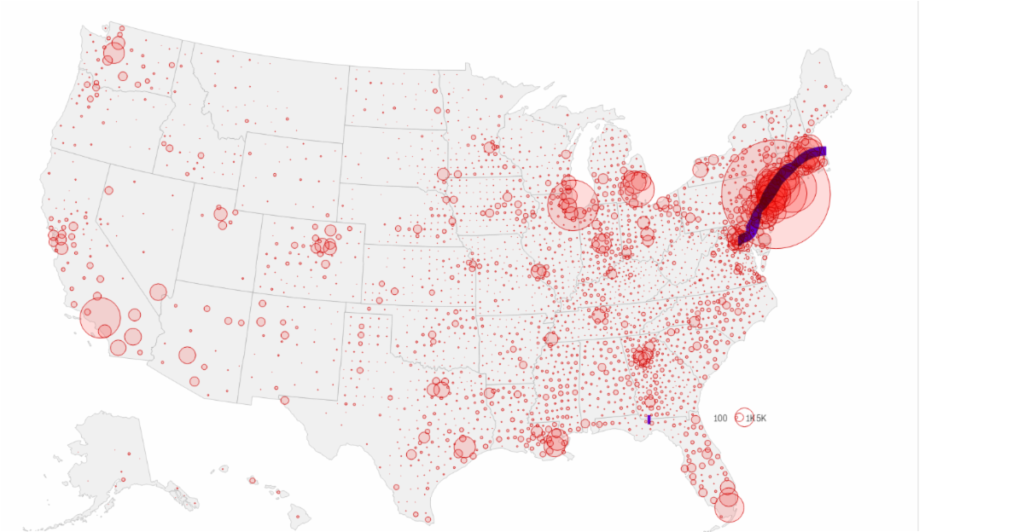
We’ve frequently discussed how COVID 19 is regional, in that certain sections of the US have a much higher infection rate than others.
Our country’s highest concentration of cases, the Boston to NYC corridor, has in excess of 1,300 cases / 100,000 people, over six times our national average. Said a bit differently the region accounts for about half or our cases and 60% of the deaths. It is approximately 30,000 square miles, less than 1% of the entire country.
Below is a listing of some of the distinct characteristics of the region relative to the rest of the US. There are certainly others, but the point is, how can we use this information to have an improved and more effective approach to controlling COVID 19, and for those viruses yet to come. If we can use a bit of a play on words, “If we can beat it here (NYC), we can beat it anywhere.
Have a wonderful day.
PS: Several readers have told me they forward the newsletter to family and friends. Please send them directly to us, and we would be happy to add them to our distribution. Thank you.
Boston / New York City Corridor
- Densely populated
- Older buildings / HVAC systems
- Reliance on distillate fuels
- Similar weather (cold winters / chilly springs)
- Heavy reliance on public transportation
- Map courtesy of CNN