Yesterday was a FIVE Green Arrow Day.
Good Morning:
In general, the trends continued along their favorable path.
Today, we’d like to discuss a significant unreported statistic, “Net Cases.” We calculate this number by using total accumulated reported cases and subtract cases at least two weeks old (Theoretical Recoveries) and the fatalities. We are using Ohio as an example.
The Ohio Department of Health reports that there have been 20,969 cases, 1,135 deaths and, zero recoveries. Using our “Theoretical Recoveries” (see table, tab Theoretical Recoveries) we, calculate that the “Net Cases” are 6,101, about 30% of the accumulated total.
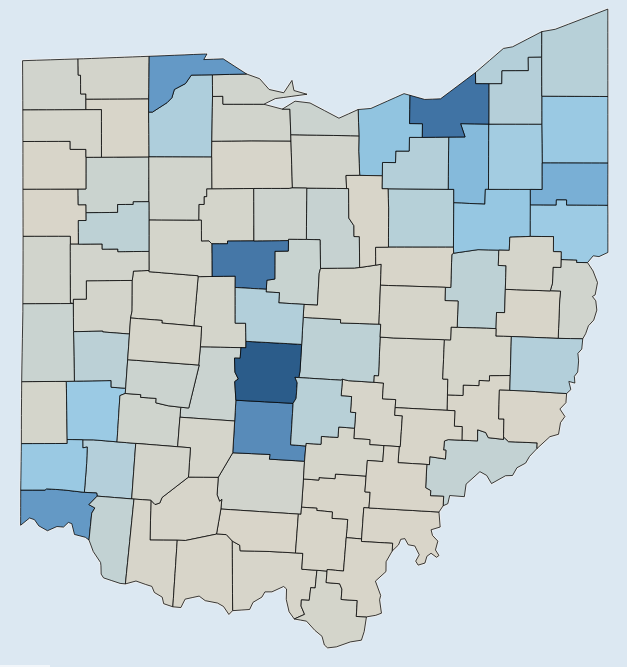
For reference, Ohio’s population is 11.7 million and, on an accumulated case basis, has a rate of 179 cases / 100,000. Using our “Net Case” calculation, the rate per 100,000 would drop to 52 or 0.052% of the total population. Now take a look at the map from the same Department of Health which, shows accumulated cases. Notice the five counties that are either very dark or dark blue. Imagine that map showing only 6,101 cases. It would be a far more meaningful map.
Furthermore, at least in one county, Marion, of the accumulative cases 2,335, 2,198 are at least two weeks old, meaning there are only 126 active cases (there were nine deaths). In Marion, you might recall had a state prison that became a hot spot.
The point we are attempting to make is that “Net Cases” may be the most fundamental statistic for determining where to add or modify restrictions.
PS: Several readers have told me they forward the newsletter to family and friends. Please send them directly to us, and we would be happy to add them to our distribution. Thank you.
Ohio Department of Health Map
- Accumulated cases: 20,969
- Deaths: 1,135
- Rate per 100,000 = 179
- Population: 11.7 million
- Buckeye state